mirror of
https://gitlab.com/magicalsoup/Highschool.git
synced 2025-10-24 12:11:37 -04:00
5.3 KiB
5.3 KiB
Unit 5: Analytical Geometry and Linear Relations
Linear Relation: A relation which a single straight line can be drawn through every data point and the first differences are constant
Non - Linear Relation: A single smooth curve can be drawn through every data point and the first differences are not constant
Slope and Equation of Line
Slope: The measure of the steepness of a line -rise / runorthe rate of change
Slope Formula: \(`m = \dfrac{y_2 - y_1}{x_2 - x_1}`\)
Standard Form: \(`ax + by + c = 0, a \isin \mathbb{Z}, b \isin \mathbb{Z}, c \isin \mathbb{Z}`\) (must be integers and \(`a`\) must be positive)
Y-intercept Form: \(`y = mx + b`\)
Point-slope Form: \(`y_2-y_1 = m(x_2-x_1)`\)
- The slope of a vertical lines is undefined
- The slope of a horizontal line is 0
- Parallel lines have the
same slope
- Perpendicular slopes are negative reciprocals
Relations
- A relation can be described using
- Table of Values (see below)
- Equations \(`(y = 3x + 5)`\)
- Graphs (Graphing the equation)
- Words
- Table of Values (see below)
- When digging into the earth, the temperature rises according to the
- following linear equation: \(`t = 15 + 0.01 h`\). \(`t`\) is the increase in temperature in
- degrees and \(`h`\) is the depth in meters.
Perpendicular Lines
- To find the perpendicular slope, you will need to find the slope
point
- Formula: slope1 × slope2 = -1
- Notation: \(`m_\perp`\)
Definitions
Parallel: 2 lines with the same slope
Perpendicular: 2 lines with slopes that are the negative reciprocal to the other. They form a 90 degree angle where they meet.
Domain: The ordered set of all possible values of the independent variable \(`x`\).
Range: The ordered set of all possible values of the dependent variable \(`y`\).
Continous Data: A data set that can be broken into smaller parts. This is represented by aSolid line.
Discrete Data: A data set that cannot be broken into smaller parts. This is represented by aDashed line.
First Difference: the difference between 2 consecutive y values in a table of values which the difference between the x-values are constant.
Collinear Points: points that line on the same straight line
Variables
Independent Variable: A Variable in a relation which the values can be chosen or isn’t affected by anything.
Dependent Varaible: A Variable in a relation which is dependent on the independent variable.
Statistics
Interpolation: Data inside the given data set range.
Extrapolation: Data outside the data set range.
Line of Best Fit: A line that goes through as many points as possible, and the points are the closest on either side of the line,- and it represents the trend of a graph.
Coefficient of Correlation: The value that indicates the strength of two variables in a relation. 1 is the strongest and 0 is the weakest.
Partial Variation: A Variation that represents a relation in which one variable is a multiple of the other plus a costant term.
Time - Distance Graph
- Time is the independent variable and distance is the dependent
variable
- You can’t go backwards on the x-axis, as you can’t go back in
time
- Plot the points accordingly
- Draw the lines accordingly
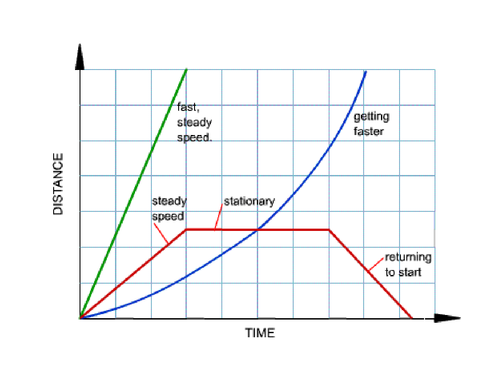
Direction is always referring to:
go towards home
going away from home
stop
Scatterplot and Line of Best Fit
- A scatterplot graph is there to show the relation between two
variables in a table of values.
- A line of best fit is a straight line that describes the relation
between two variables.
- If you are drawing a line of best fit, try to use as many data
points, have an equal amount of points onto and under the line of best
fit, and keep it as a straight line.

How To Determine the Equation Of a Line of Best Fit
- Find two points
ONtheline of best fit - Determine the
slopeusing the two points - Use
point-slope formto find the equation of theline of best fit
Table of values
- To find first differences or any points on the line, you can use a
table of values
| y | x | First Difference |
|---|---|---|
| -1 | -2 | ….. |
| 0 | -1 | (-1)-(-2) = 1 |
| 1 | 0 | 0 - (-1) = 1 |
| 2 | 1 | 1 - 0 = 1 |
| 3 | 2 | 2 - 1 = 1 |
| 4 | 3 | 3 - 2 = 1 |
Tips
- Label your graph correctly, the scales/scaling and always the
independent variableon thex-axisand thedependent variableony-axis
- Draw your
Line of Best Fitcorrectly
- Read the word problems carefully, and make sure you understand it
when graphing things
- Sometimes its better not to draw the shape, as it might cloud your
judgement (personal exprience)
- Label your lines